

Strategic Planning
The strategy map in the same place where the figure happens.
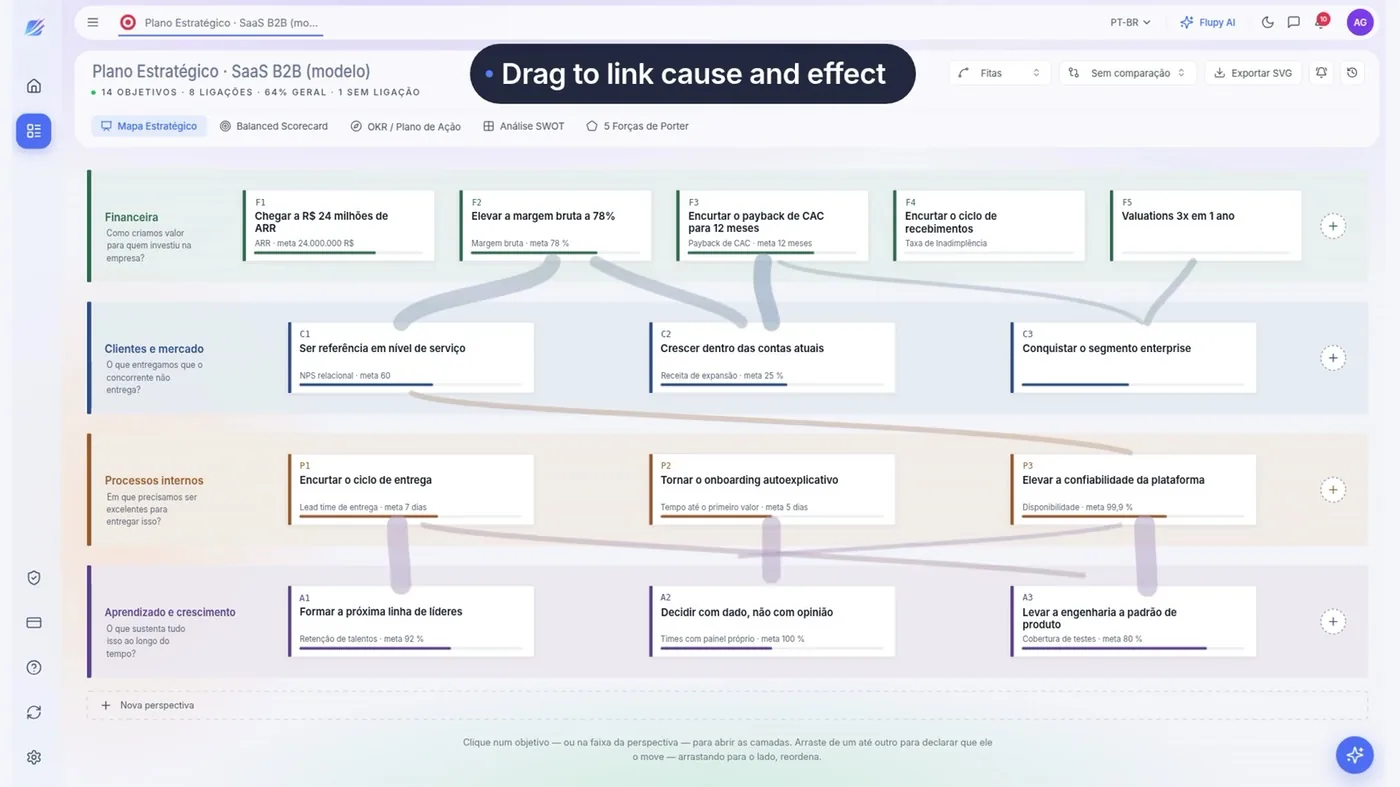
The objectives spread across the four perspectives, with the causal links between them — anchored in the base that measures whether the plan is moving.
- The interface
- Strategy Map
- Duration
- 27 s
- Area
- Strategy
Companies already operating on LeverPro








5 business days
for the P&L to be ready at Distrivisa — before, it only closed on the 15th
Distrivisa
+100
ERPs integrated natively, the Brazilian ones included
12
native surfaces reading the same base
ISO 27001
information security management
WHAT HOLDS IT UP TODAY
The plan becomes a slide, and the objective has no figure
It is not a lack of effort: it is the format. A spreadsheet has nowhere to hold the rule, the trail and the permission at once.
The plan becomes a slide and vanishes
It is presented in January and reopened in December. In between, nobody measures.
The objective has no figure
The intent is written down, but the metric that would say whether it is being met lives in another system.
Cause between objectives is assumed
The map draws arrows, and nobody checks whether the link holds.
STRATEGIC PLANNING
Strategy Map running in LeverPro
27 seconds of the platform really running, recorded from the interface itself. Press play.
Strategy map in LeverPro, with objectives spread across the plan's four perspectives.
WHAT YOU SEE ON SCREEN
The objectives across the four perspectives, linked to the figure
Four things happen on this screen, and each one settles a piece of the month.
- 0:03
The four perspectives
Financial, customer, process and learning — the map's structure, built as data.
- 0:10
The objectives in place
Each in the perspective it belongs to, with the description the team wrote.
- 0:17
The cause-and-effect links
What supports what. Reading it bottom-up is the plan's argument.
- 0:23
The link to the base
The objective points to the metric that measures it, and the metric reads the engine.
BEFORE AND AFTER
The same operation, in both formats
How it runs today
- The plan lives in a slide nobody reopens
- Objective with no metric attached
- The cause arrows are never checked
- The plan is reviewed yearly because measuring is hard work
With LeverPro
- The map is a platform object, not a picture
- Each objective points to the figure that measures it
- The causal link becomes explicit and reviewable
- Measuring means reading the base, so reviewing stops being a project
Want to see this on your own figures, and not the video's?
Book a diagnosticHOW IT WORKS
From the ERP entry to the interface
Three steps, and the second is the one most tools skip.
-
The structure is data
Perspective, objective and relation are objects, and so they can be read, filtered and measured.
-
The metric comes from the engine
What measures the objective is the same figure that closes the month.
-
Revision is continuous
Since measuring means reading, revising the plan no longer needs a yearly scramble.
WHO USES IT
What each role takes from this
CFO
Links the plan to the result without building a deck for it.
Planning
Keeps the map alive instead of reviving it in December.
Executive board
Reads the plan with the figure beside the objective.

“LeverPro delivered efficiency, speed and lower risk, ending the dependence on multiple spreadsheets and making financial decisions far more reliable.”
SNEF Brasil · Engineering
RELATED INTERFACES
Other Strategy interfaces
The same base, a different operation.
-
 Strategic Planning
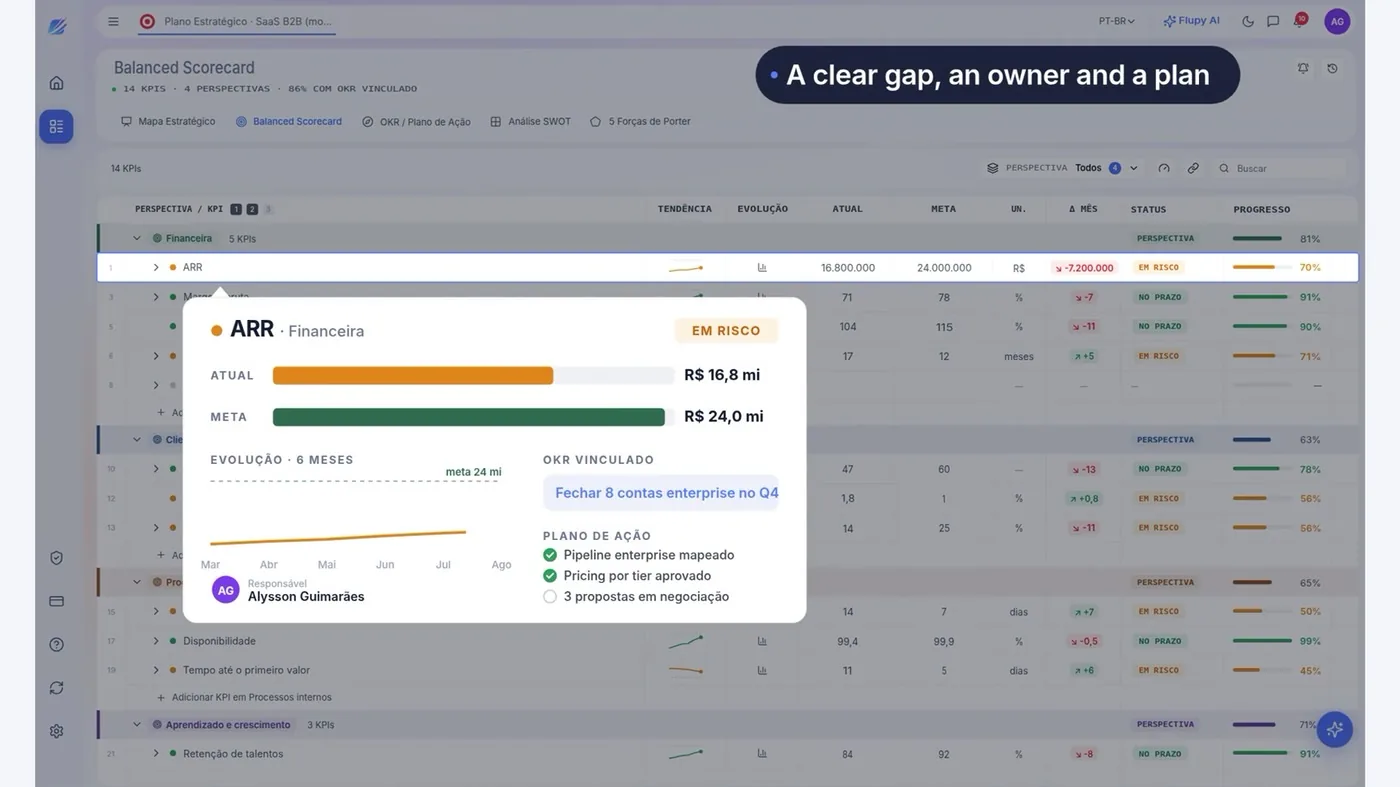
Balanced Scorecard
Fourteen metrics across four perspectives, with the OKRs linked.
See the interface
-
 Strategic Planning
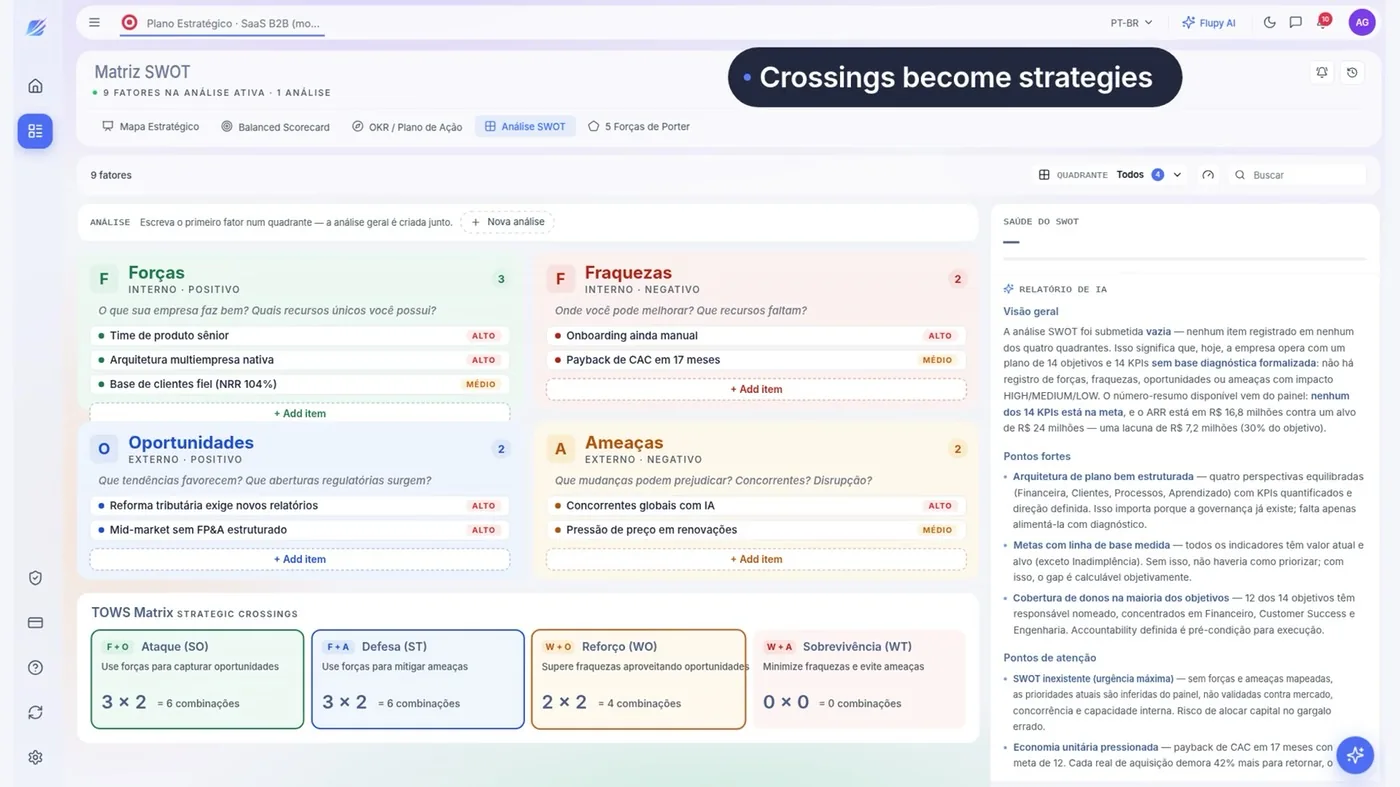
SWOT Analysis
Strengths, weaknesses, opportunities and threats linked to the plan.
See the interface
-
 Strategic Planning
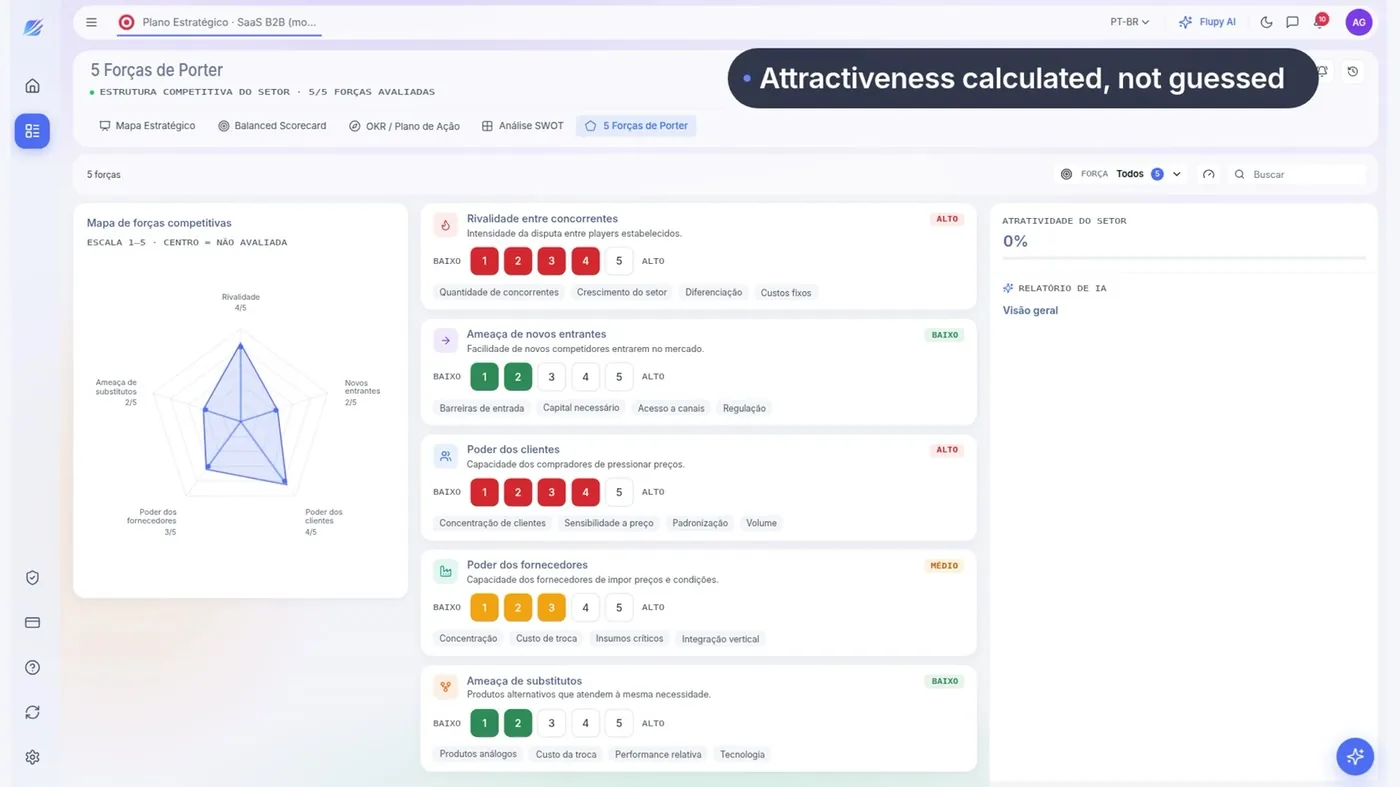
Porter's Five Forces
The sector's competitive structure assessed force by force.
See the interface
- See Strategy in full The area's 4 interfaces, what holds it up today and who uses it. Open
QUESTIONS
What people usually ask about this interface
If yours is not here, ask — we reply within one business day.
Does it have to be a Balanced Scorecard?
Does the map stay linked to the metrics?
Who edits the map?
Can the plan be versioned?
RECOGNITION



Four years running in the 100 Open Startups ranking.
HOW YOUR DATA IS KEPT
-
Who gets in
Corporate authentication through the identity provider the company already uses.
-
Who sees what
Permission by area and by slice, on the same base — with no copy of the file.
-
Where the figure came from
A trail from the consolidated figure to the source accounting entry.
-
How the data comes out
Export guaranteed. The data belongs to your company.
Let's look at your budget cycle
Thirty minutes with people who do this every day, about how your planning runs today.
You leave knowing what can be solved first — or with us telling you it doesn't make sense.
No spam and no mailing list — we reply within one business day.
What happens in the conversation
- You tell us how planning runs today
- We point out what can be solved first
- Where LeverPro fits into your ERP and your spreadsheets
- Or we tell you it doesn't make sense, and that's that
How your data is kept
ISO 27001LGPDSSO / SAMLExportable data