

Financial Reports
The executive dashboard reading the same base that closes the month.
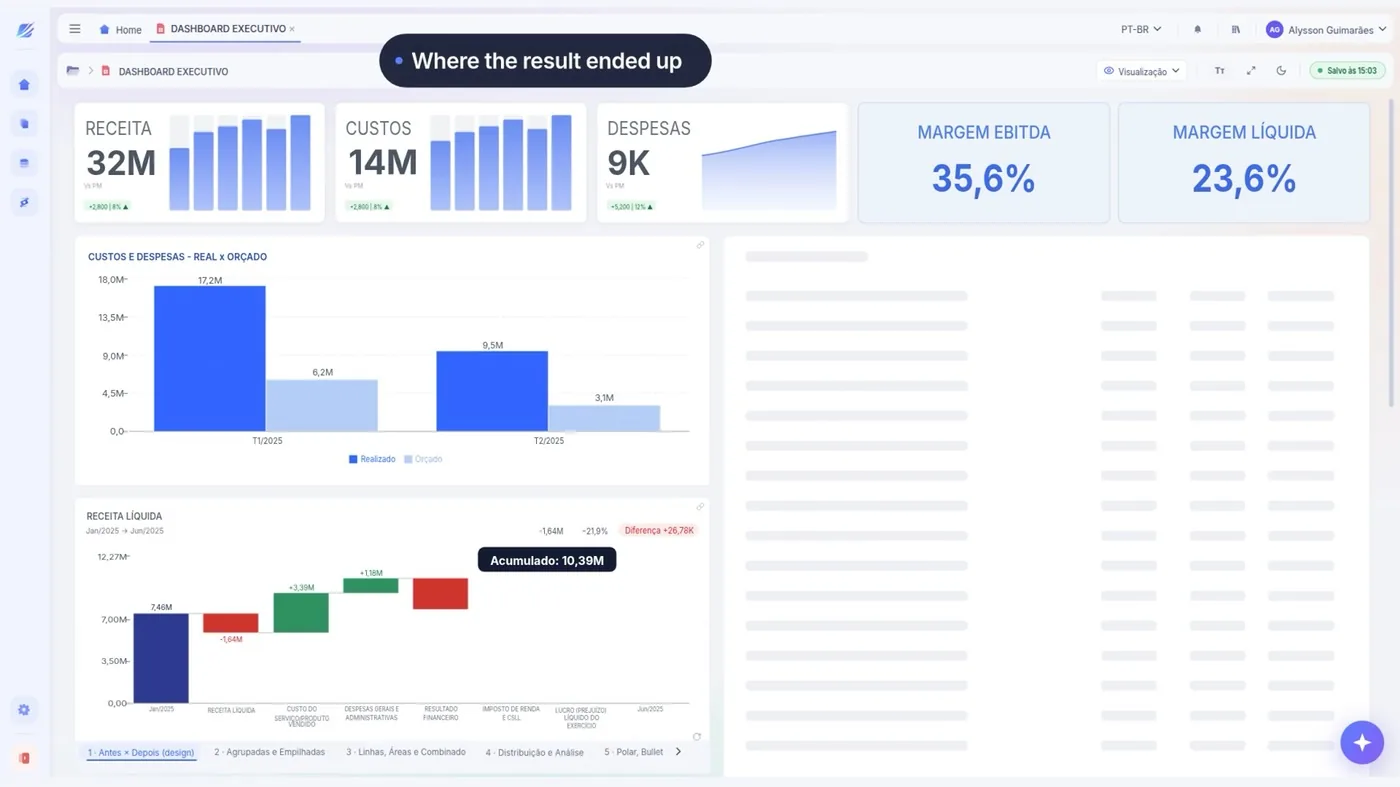
The period's metrics, the trend over recent months and a comparison by area — built on the same engine that generates the P&L, and so always on the same figure.
- The interface
- Executive Dashboard
- Duration
- 44 s
- Area
- Controllership
Companies already operating on LeverPro








5 business days
for the P&L to be ready at Distrivisa — before, it only closed on the 15th
Distrivisa
+100
ERPs integrated natively, the Brazilian ones included
12
native surfaces reading the same base
ISO 27001
information security management
WHAT HOLDS IT UP TODAY
The dashboard and the P&L disagree, and nobody knows which one counts
It is not a lack of effort: it is the format. A spreadsheet has nowhere to hold the rule, the trail and the permission at once.
The dashboard and the P&L disagree
One pulls from BI, the other from the spreadsheet, and the two were updated at different times. The meeting loses twenty minutes deciding which to believe.
Updating the dashboard is a project
Each new metric means a request to IT or the BI team. Whoever needs the answer is not the one who can produce it.
The dashboard shows, but does not explain
The chart dropped. To find out why, you leave the dashboard, open another tool and rebuild the path.
FINANCIAL REPORTS
Executive Dashboard running in LeverPro
44 seconds of the platform really running, recorded from the interface itself. Press play.
LeverPro's executive dashboard, with the month's indicators, trend charts and comparisons by area.
WHAT YOU SEE ON SCREEN
The month's metric, and the line behind it
Four things happen on this screen, and each one settles a piece of the month.
- 0:03
The period's metrics
Revenue, margin, expense and cash read from the engine at the same moment — not from an overnight load.
- 0:14
Month-by-month change
The series comes from the same base as the close, so the history does not have to be rebuilt every time a criterion changes.
- 0:27
The comparison by area
Cost centre, branch and project on the same slice the P&L uses. It is the same breakdown, not a similar one.
- 0:38
From the chart to the detail
Clicking the metric drills down to the line behind it. The dashboard stops being a poster and becomes a starting point.
BEFORE AND AFTER
The same operation, in both formats
How it runs today
- The BI dashboard refreshes overnight, the P&L refreshes when someone saves
- A new metric is a support ticket, not a decision
- The chart shows the drop and the explanation is somewhere else
- Each board area has its own dashboard, with its own cut
With LeverPro
- Dashboard and statement read the same engine, at the same moment
- The slice belongs to the data — change the assumption, the dashboard changes
- From the metric to the entry, without switching tools
- One dashboard, with permission by area instead of copies
Want to see this on your own figures, and not the video's?
Book a diagnosticHOW IT WORKS
From the ERP entry to the interface
Three steps, and the second is the one most tools skip.
-
The base is the close's
No parallel extract for the dashboard. What feeds it is the same data that closes the month.
-
The metric is a rule, not a query
A margin defined once holds for the dashboard, the P&L and the board presentation.
-
The surface is the reader's choice
The same figure appears in dashboard, spreadsheet, document and slide. Switching surface is not recalculating.
WHO USES IT
What each role takes from this
CFO
Arrives at the meeting with the dashboard open and the detail one click away, asking nobody for the file.
Controller
Publishes one dashboard and controls who sees what, instead of handing out versions.
FP&A
Creates the metric the analysis needs without raising a ticket with the BI team.

“Controllership now runs with higher productivity and confidence in the data. LeverPro brought speed, accuracy and a single place for our information.”
Grupo Santa Joana · Healthcare
RELATED INTERFACES
Other Controllership interfaces
The same base, a different operation.
-
 Financial Reports
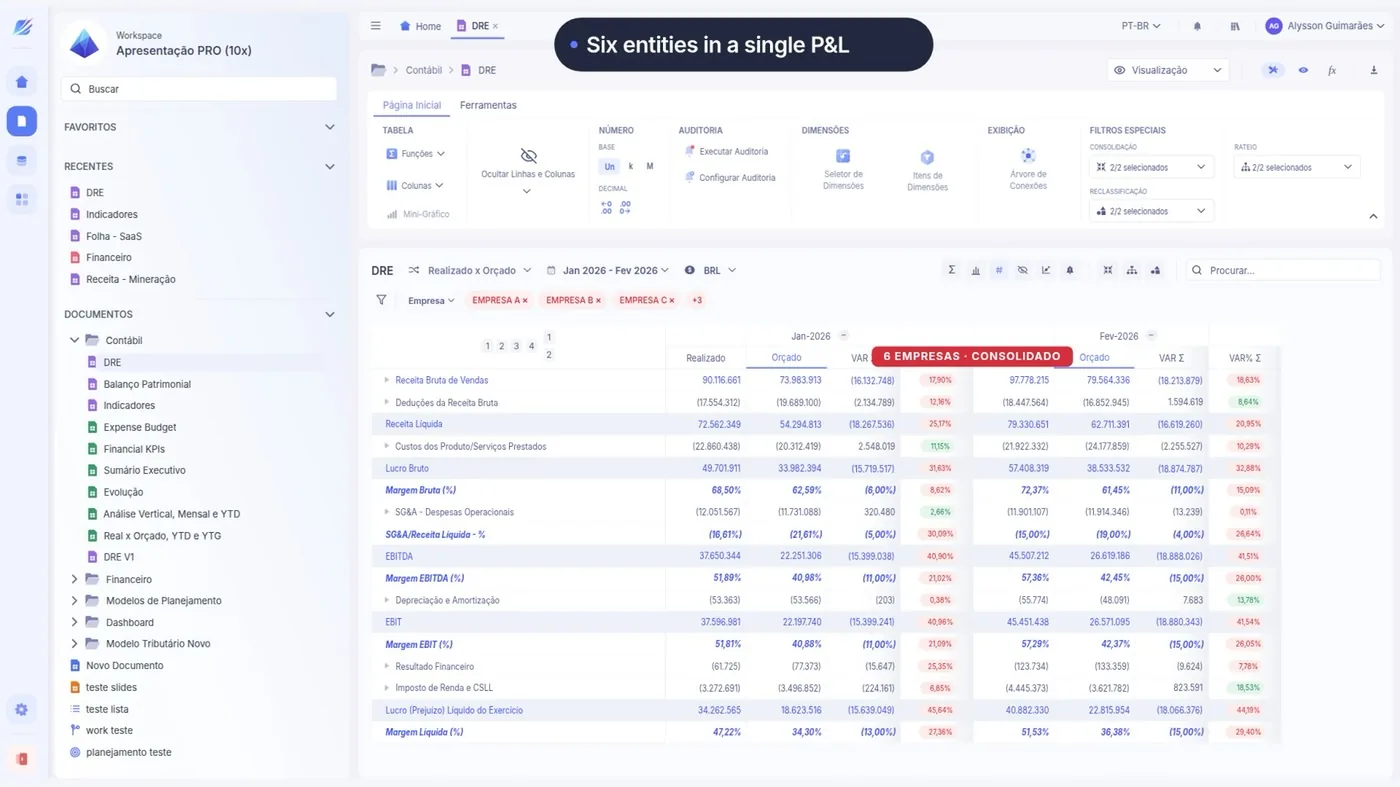
Management P&L
Revenue, cost and EBITDA with the budget beside them, straight from the ledger.
See the interface
-
 Financial Reports
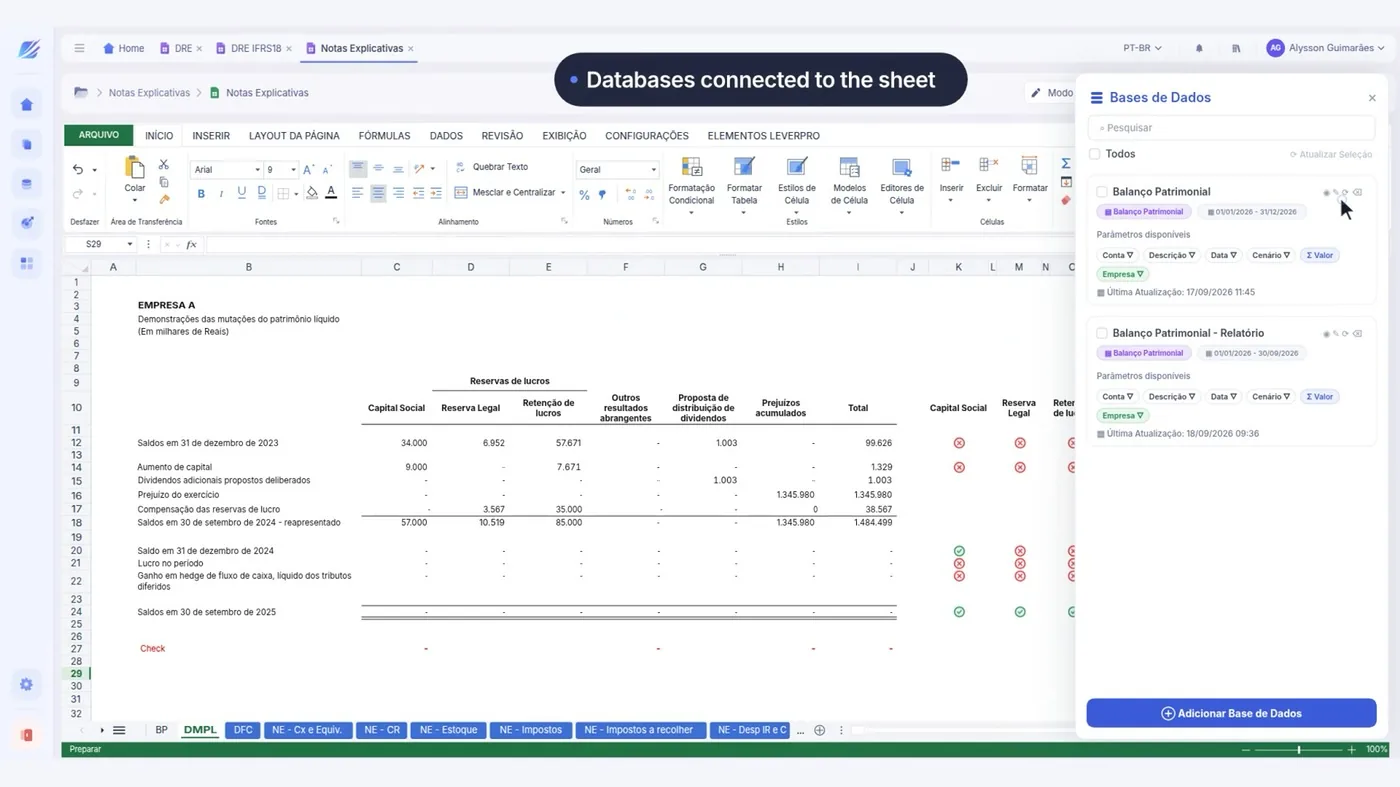
Notes to the Statements
Doc AI writes the note beside the statement, reading its figures.
See the interface
- See Controllership in full The area's 3 interfaces, what holds it up today and who uses it. Open
QUESTIONS
What people usually ask about this interface
If yours is not here, ask — we reply within one business day.
Does this replace Power BI?
Can each director have their own view?
How often does the dashboard refresh?
Can the dashboard be taken into the board presentation?
RECOGNITION




Four years running in the 100 Open Startups ranking.
HOW YOUR DATA IS KEPT
-
Who gets in
Corporate authentication through the identity provider the company already uses.
-
Who sees what
Permission by area and by slice, on the same base — with no copy of the file.
-
Where the figure came from
A trail from the consolidated figure to the source accounting entry.
-
How the data comes out
Export guaranteed. The data belongs to your company.
Let's look at your budget cycle
Thirty minutes with people who do this every day, about how your planning runs today.
You leave knowing what can be solved first — or with us telling you it doesn't make sense.
No spam and no mailing list — we reply within one business day.
What happens in the conversation
- You tell us how planning runs today
- We point out what can be solved first
- Where LeverPro fits into your ERP and your spreadsheets
- Or we tell you it doesn't make sense, and that's that
How your data is kept
ISO 27001LGPDSSO / SAMLExportable data